| Muster | Symbol | Datum | vor Tagen | nr | retr1 | retr2 | retr retr | exten sion | retr verh | a/c Preis | a/c Zeit | l/h | Teil2/ Teil1 | Dauer | m davor | R2 davor | trend davor 1=auf 2=auf+Ue | DivTyp macd/ rsi | trend | v100 symbol sector -15.0 1000.0 | v200 symbol sector -25.0 1000.0 | p10 subindustry -5.0 1000.0 | v20 symbol sector -9.0 1000.0 | v10 symbol subindustry -2.8 1000.0 | vergleich 20Tage -4.0 1000.0 | v50 symbol sector -13.0 1000.0 | v20 symbol subindustry -6.0 1000.0 | retracement1 32.0 1000.0 | p200 subindustry -3.5 1000.0 | v200 symbol subindustry -10.0 1000.0 | p10 symbol -1.0 1000.0 | p200 sector 1.5 1000.0 | typ divergenz nan nan | sma200 vergleich abstand nan nan | p200 symbol nan nan | dauer gesamt nan nan | p20 subindustry nan nan | v10 symbol sector nan nan | last200 Tage High atr50 nan nan | EPS diluted nan nan | p20 symbol nan nan | vergleich 200Tage nan nan | p10 subindustry nan nan | Regel | links | sektoren |
|---|---|---|---|---|---|---|---|---|---|---|---|---|---|---|---|---|---|---|---|---|---|---|---|---|---|---|---|---|---|---|---|---|---|---|---|---|---|---|---|---|---|---|---|---|---|---|
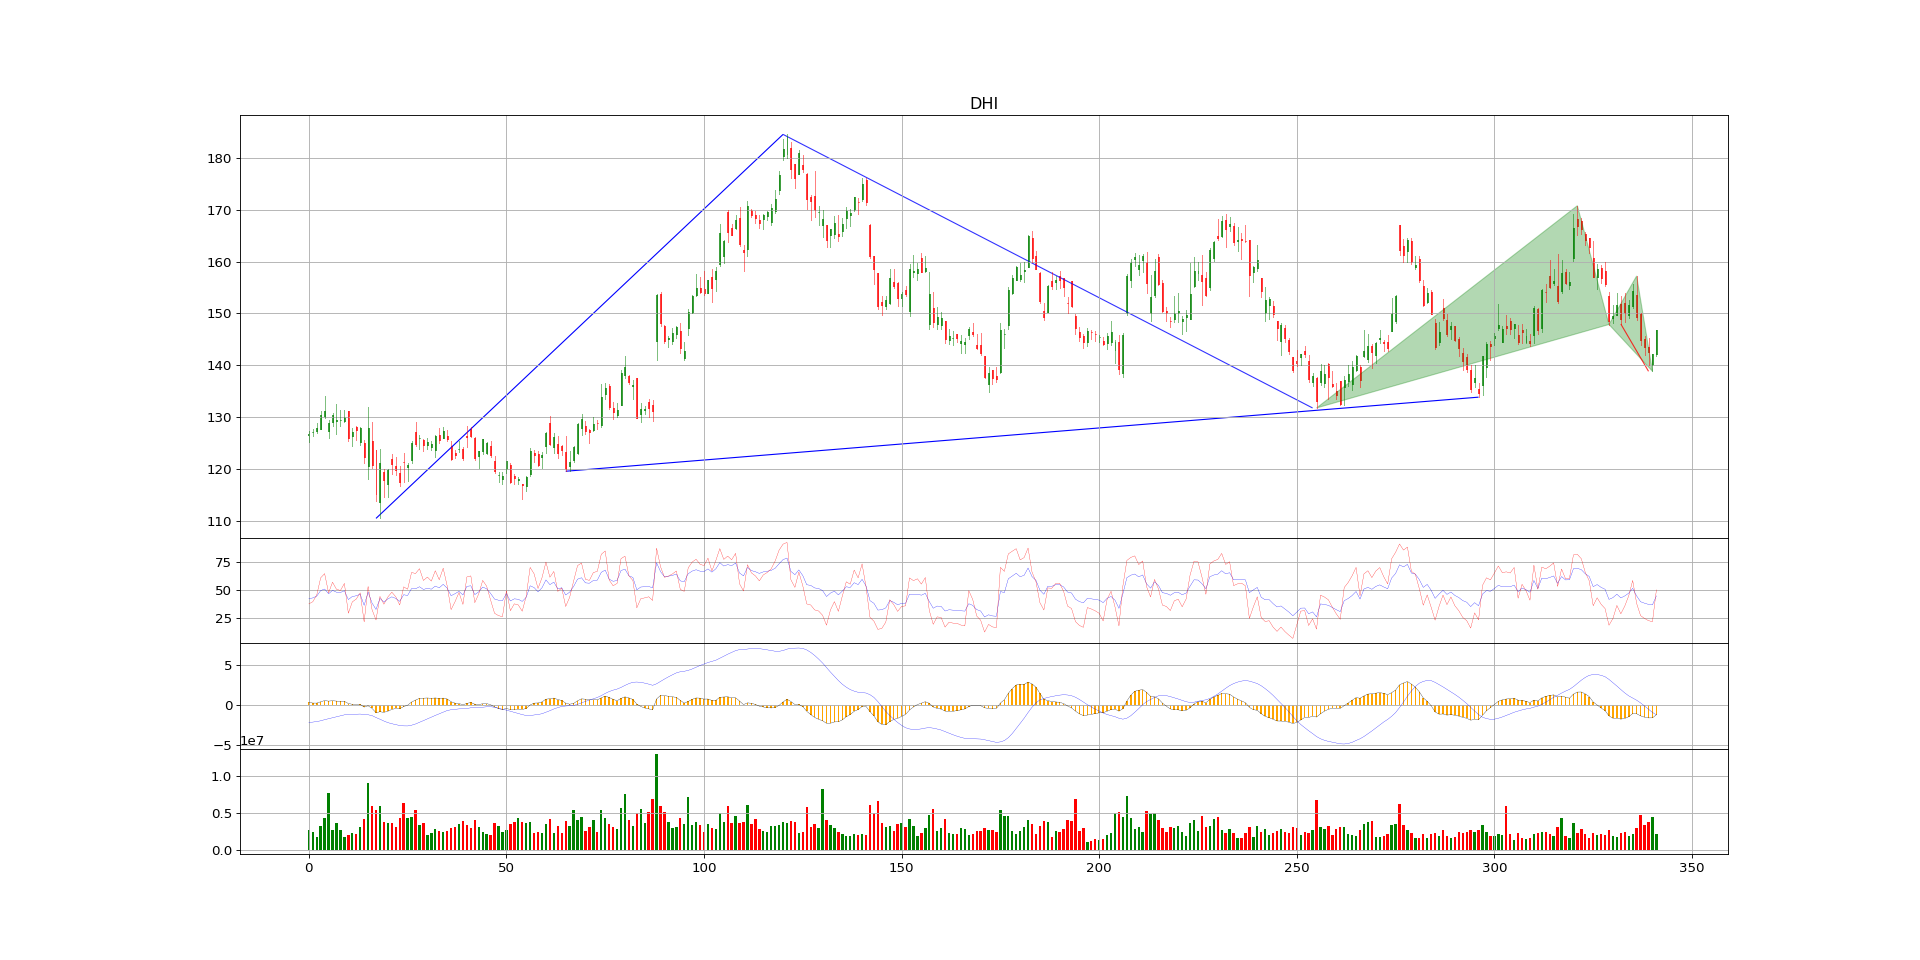
| gartley120 | DHI | 2026-07-23 | 1 | 1199 | 58.73 | 81.86 | 40.86 | 196.37 | 1.394 | 1.246 | 1.75 | 10.8 | 0.29 | 85 | 0.03 | 0.383 | 0 | 3/3 | 13/231/0.07/0 | nan | nan | nan | nan | nan | nan | nan | nan | 58.73 | nan | nan | -6.66 | nan | 0 | 4.854 | -20.69 | 85 | nan | nan | 4.0512 | 4.29 | -17.47 | nan | nan | yahoo stockcharts finviz | Consumer Discretionary Sector, Home Construction,comp.S,comp.I | |
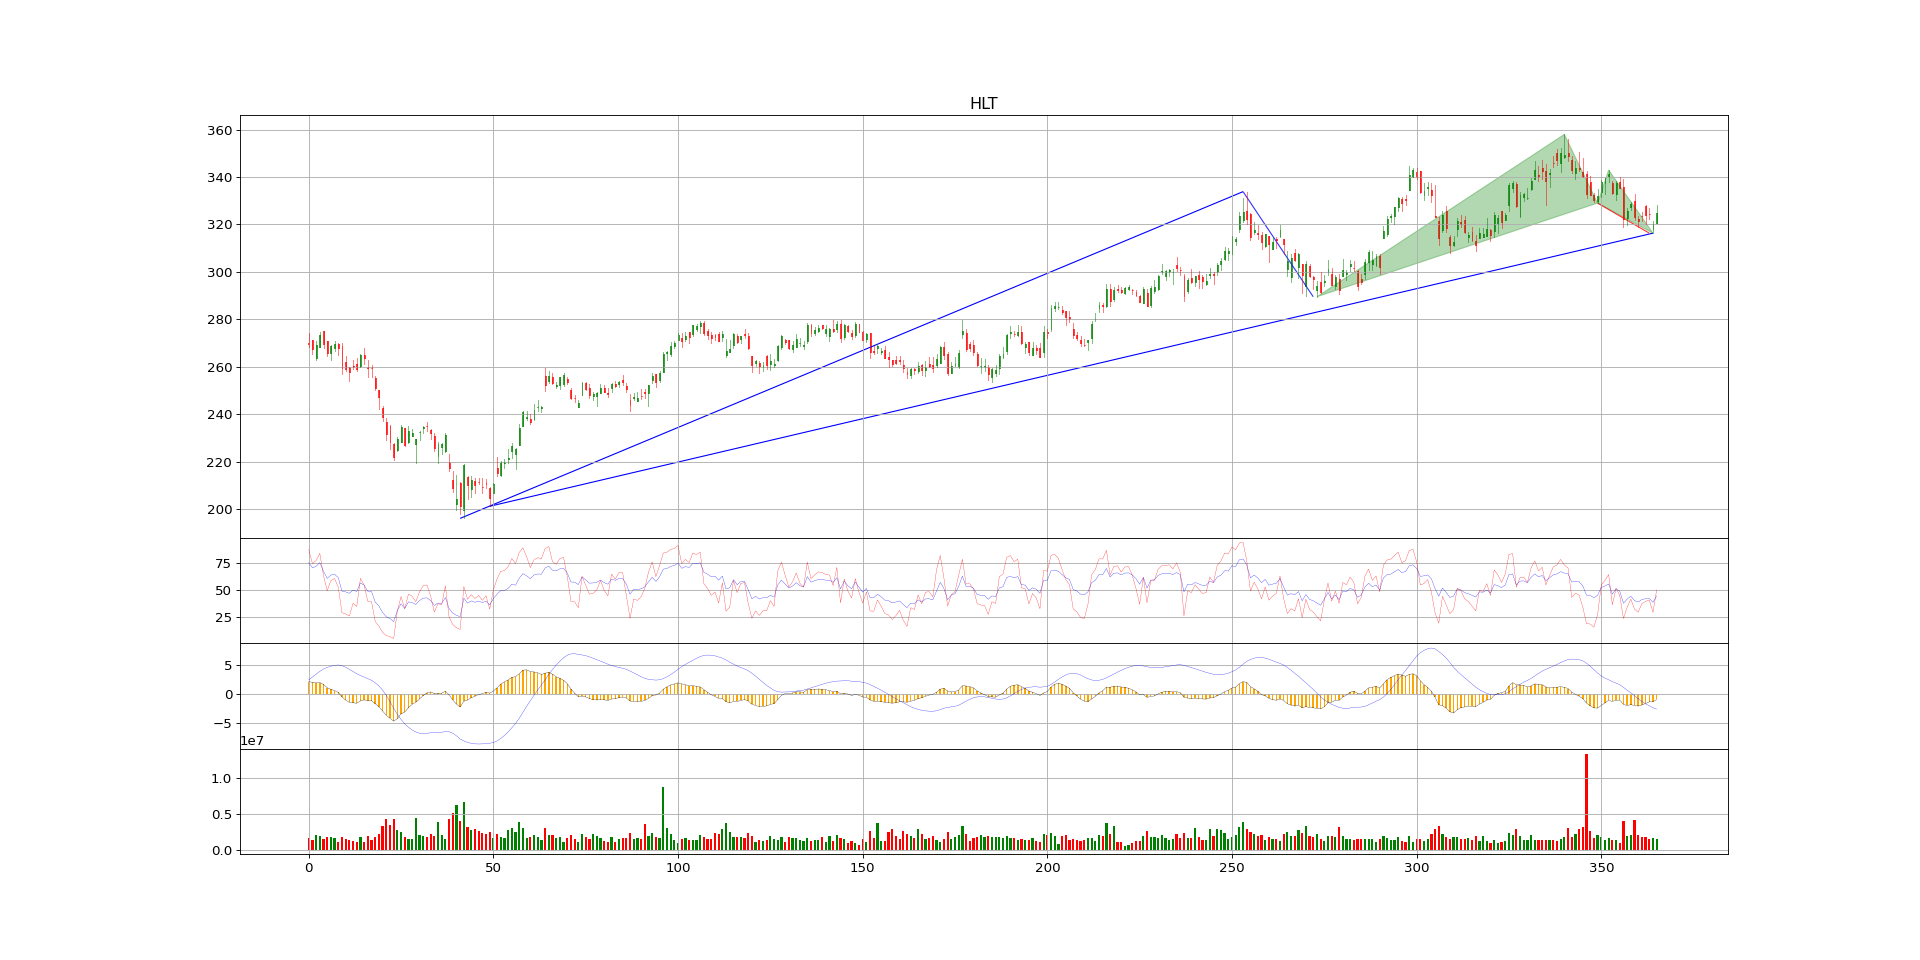
| gartley120 | HLT | 2026-07-23 | 1 | 1199 | 42.3 | 60.82 | 48.15 | 190.9 | 1.438 | 1.088 | 0.667 | 10.03 | 0.36 | 91 | 0.039 | 0.659 | 1 | 3/1 | 17/315/0.212/0 | nan | nan | nan | nan | nan | nan | nan | nan | 42.3 | nan | nan | -4.78 | nan | 2 | 4.854 | 18.74 | 91 | nan | nan | 3.3105 | 3.22 | -6.36 | nan | nan | yahoo stockcharts finviz | Consumer Discretionary Sector, Hotels,comp.S,comp.I | |
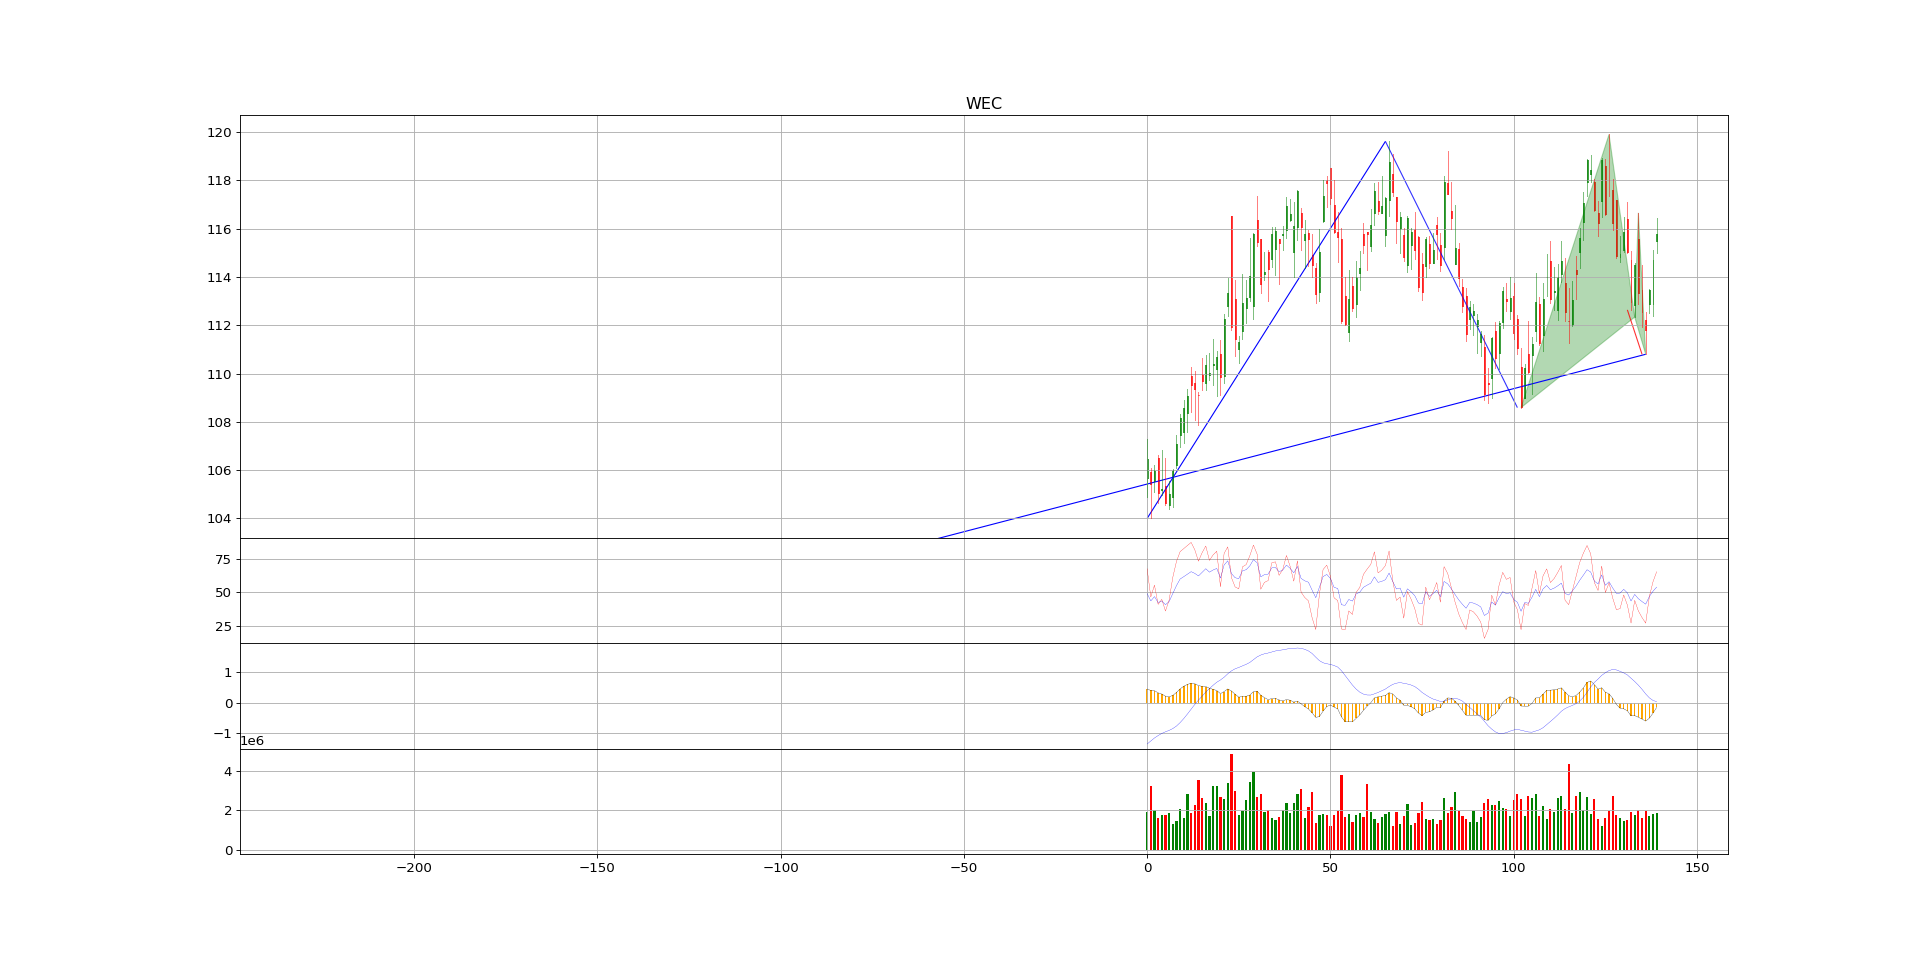
| gartley120 | WEC | 2026-07-21 | 3 | 1197 | 66.87 | 80.48 | 57.07 | 135.65 | 1.204 | 1.292 | 3.0 | 6.11 | 0.42 | 34 | 0.029 | 0.228 | 0 | 0/0 | 18/365/-0.54/0 | nan | nan | nan | nan | nan | 3.77 | nan | nan | 66.87 | nan | nan | -3.95 | nan | 0 | 6.144 | -0.19 | 34 | nan | nan | 6.4065 | 3.46 | -2.07 | 10.29 | nan | yahoo stockcharts finviz | Utilities Sector, Multiutilities,comp.S,comp.I |