| support-pattern | Symbol | Datum | vor Tagen | laenge | anz w/u | trend linie | abstand atr | Mittel Teil | sma200 | m_davor | max davor | max davor verh | retr [%] | v20 symbol subindustry -5.0 1000000.0 | v20 symbol sector -3.5 1000000.0 | vergleich 100Tage -15.0 1000000.0 | p50 sector -1000000.0 0.2 | p50 subindustry -9.0 1000000.0 | p200 sector 0.5 1000000.0 | p50 symbol -10.0 1000000.0 | p20 sector -8.0 1000000.0 | v200 symbol subindustry -7.0 1000000.0 | last200 Tage High 6.0 1000000.0 | vergleich 200Tage -15.0 1000000.0 | vergleich 20Tage -1000000.0 2.5 | Regel | links | sectors |
|---|---|---|---|---|---|---|---|---|---|---|---|---|---|---|---|---|---|---|---|---|---|---|---|---|---|---|---|---|
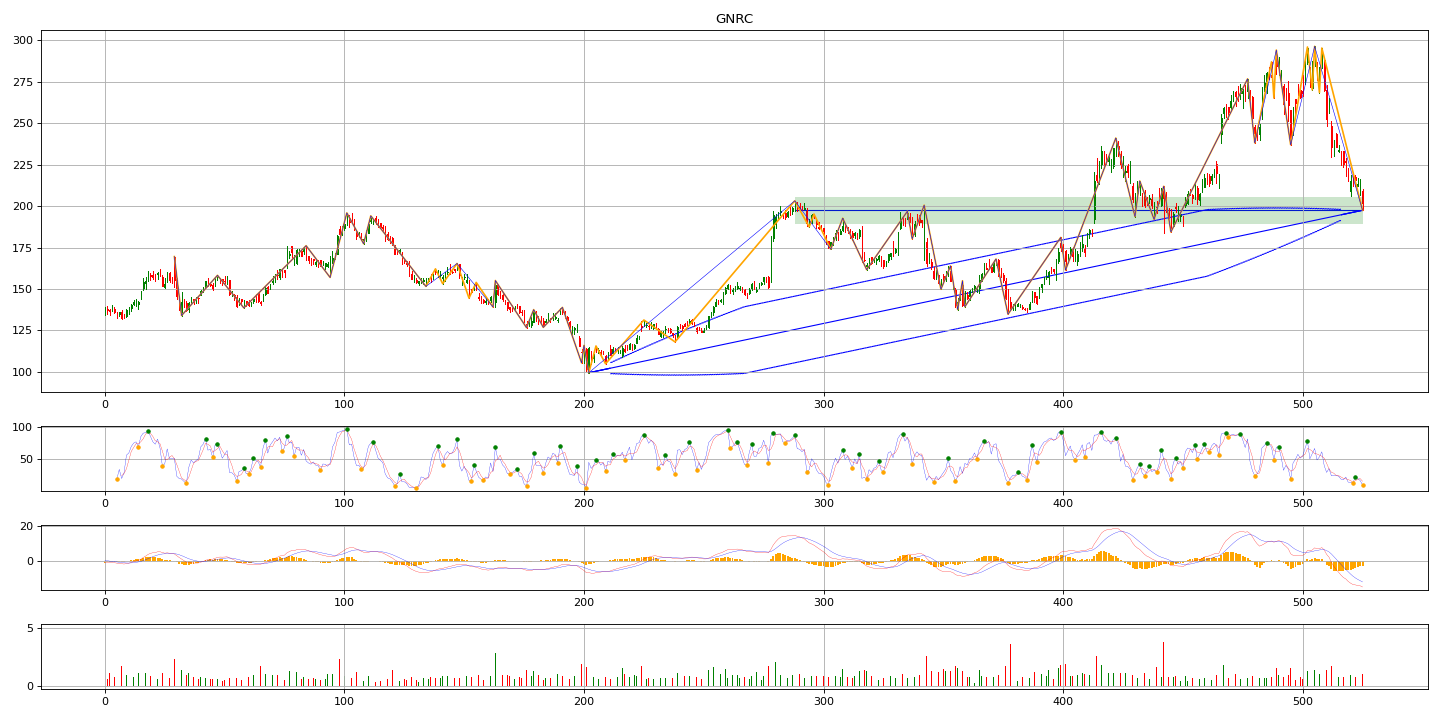
| 211 | GNRC | 2026-07-24 | 0 | 237 | 4/0 | 16/323/-0.886/0 | -0.48 | 0.18 | -0.16 | 0.9185 | 350 | 1.4768 | 61.2 | nan | nan | nan | nan | nan | nan | -32.3 | nan | nan | 20 | nan | nan | yahoo stockcharts finviz | Industrial Sector, Building Materials,comp.S,comp.I |